|
During the COVID-19 pandemic, the U.S. government has pumped unprecedented amounts of financial relief to American households to stave off potential economic disaster. From the expansions of social safety net programs like unemployment insurance and food stamps to multiple rounds of direct payments, Congress’s multiple relief packages over the last year have helped put many households on better financial footing.
Early analysis of these policies indicates that one of the groups benefiting most from these relief efforts is America’s poor. One recent report from the Urban Institute estimated that as a result of these investments, America’s poverty rate will decline to 7.7% in 2021, which would be the lowest rate on record.
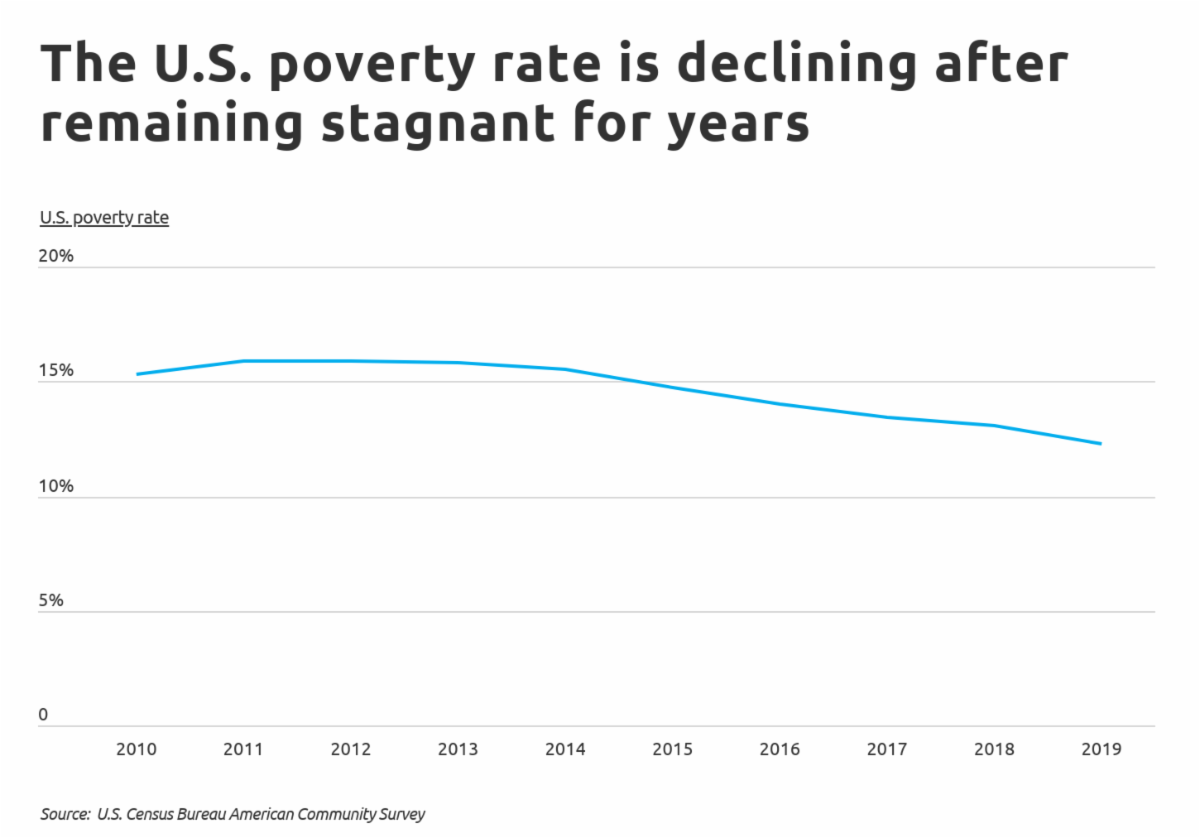
This drop in the poverty rate would represent an acceleration of a more gradual trend that has taken place for the last few years. The poverty rate rose to nearly 16% in the wake of the Great Recession. By 2019, after a steady but slow economic recovery over the previous decade, the poverty rate had fallen to 12.3%. But while the overall trends are promising, this figure still represents approximately 40 million Americans, and poverty hits some populations harder than others.
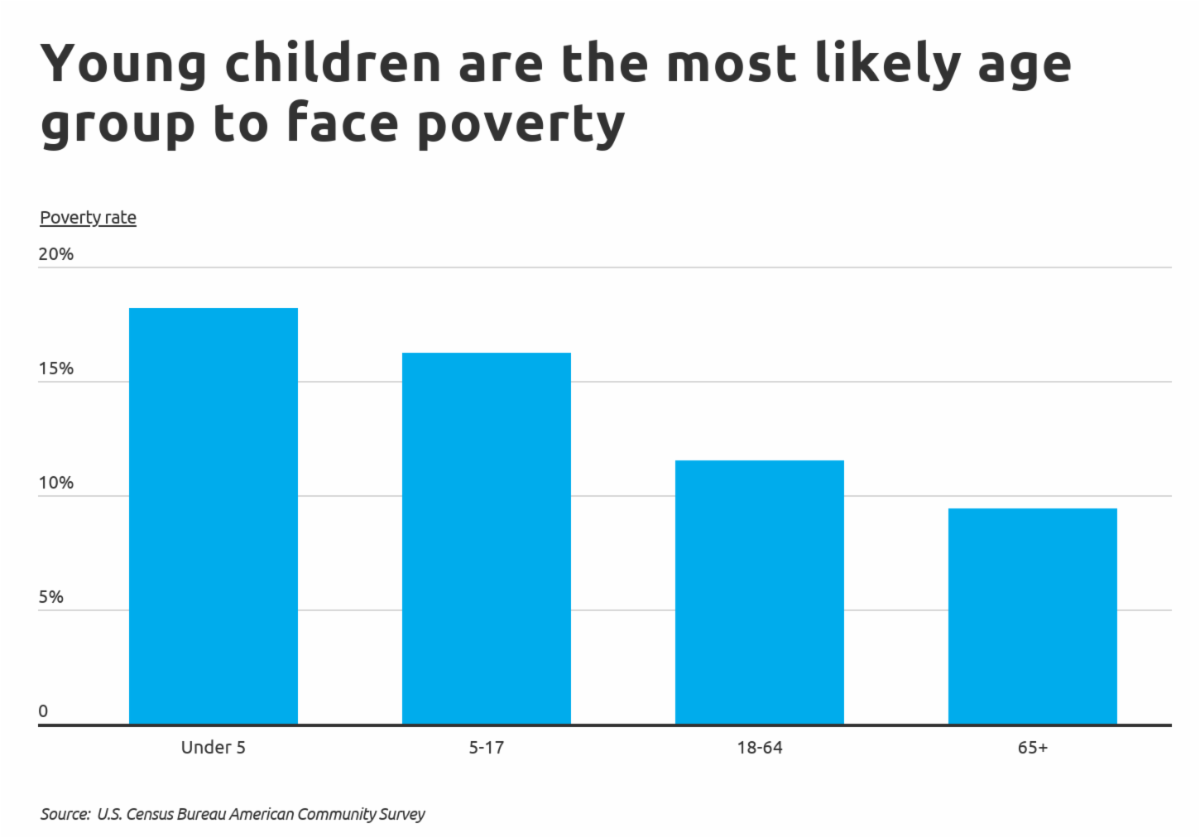
One of the demographic groups most affected by poverty in the U.S. is children. More than 18% of children under five were in poverty in 2019, while 16.2% of children aged 5–17 were in poverty. Children are unable to work, and their parents face increased costs for expenses like food, housing, and health care, which puts families with children at greater risk of poverty. However, a new expanded child tax credit passed as part of the American Rescue Plan is projected to cut child poverty in half through monthly payments to households with children. At the other end of the spectrum, Americans aged 65 and over—buoyed by long-standing safety net programs like Social Security and Medicare—have the lowest poverty rate of any age group at 9.4%.
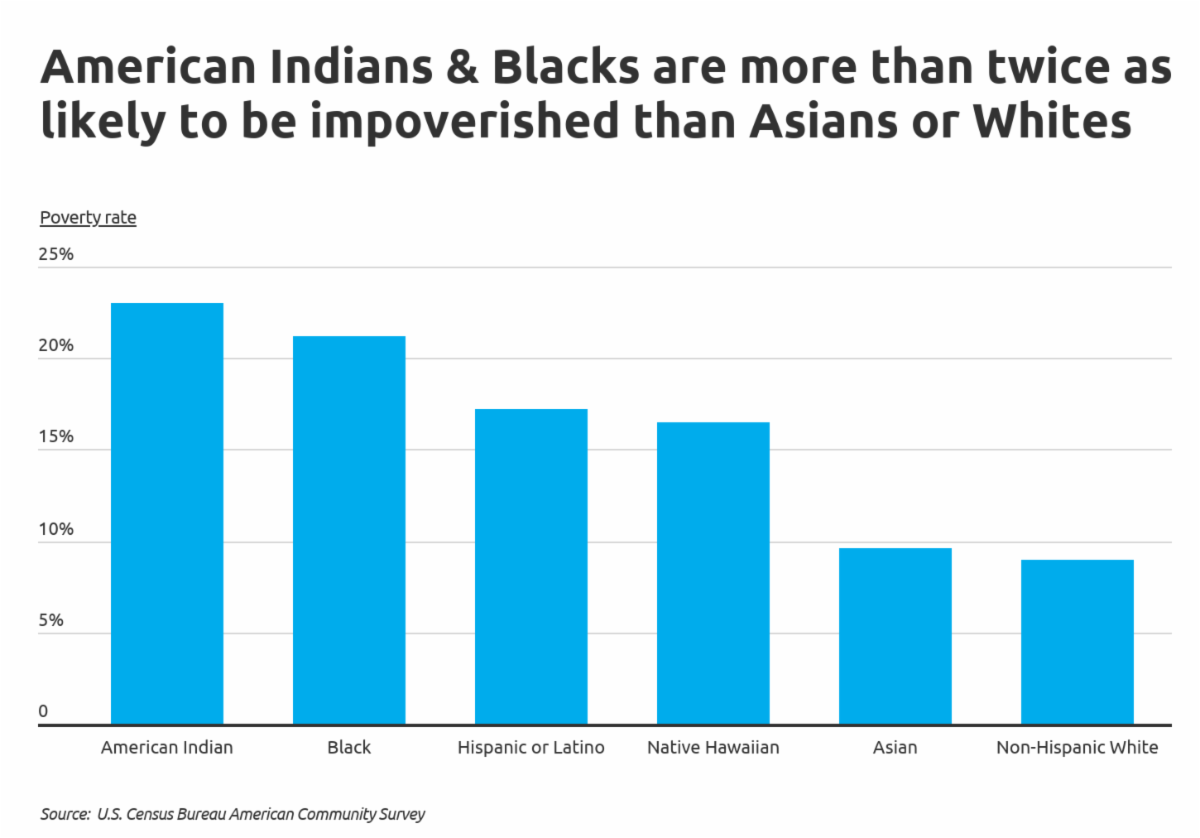
Poverty also has a strong racial dimension in the United States. White Americans had a 9% poverty rate in 2019, the lowest of any racial or ethnic category. Meanwhile, American Indians (23%) and Black Americans (21.2%) have the highest poverty rates among racial and ethnic groups, a fact attributable in large part to historical policies that have reduced economic opportunity and limited investment in those communities.
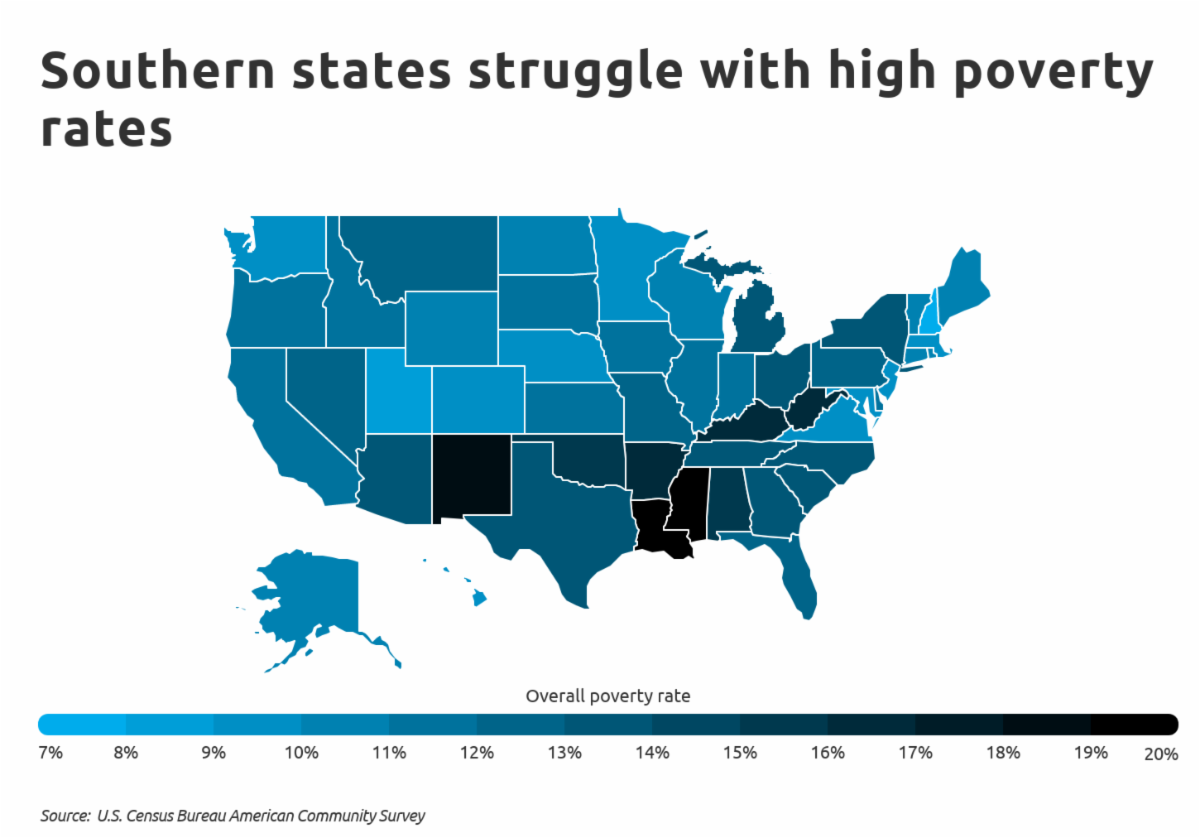
Racial and ethnic disparities in poverty rates are also a major reason why poverty is more concentrated in some locations than others. Southern states like Mississippi (19.6% poverty rate) and Louisiana (19.0%), which have higher proportions of Black residents, have some of the highest poverty rates, while states with large American Indian populations, like New Mexico and Oklahoma, are also high on the list. However, race is not the only factor: states with relatively small minority populations, like Kentucky and West Virginia, also exhibit high poverty rates (both around 16%), which are attributable to other variables like economic opportunity and educational attainment.
At the metro level, many of the same factors hold. Locations that have younger populations and more non-white residents tend to exhibit higher rates of poverty, and many of the highest-poverty metros are located in the South. Beyond that, an area’s economic health is a major factor as well: some of the locations with the highest poverty levels are cities that have been hit hard by deindustrialization, such as Cleveland and Detroit.
To find the states with the highest poverty rates, researchers at Self analyzed data from the Census Bureau’s American Community Survey. Researchers examined poverty rates for all states and collected data on both the percentage and number of people living in poverty overall and for children and racial or ethnic minorities.
The analysis found that 18.7% of Georgia children—and 17.9% of Georgia minorities—live in poverty. Overall, 13.3% of the Georgia population lives in poverty, compared to 12.3% for the U.S. as a whole. Out of all U.S. states, Georgia has the 14th highest poverty rate. Here is a summary of the data for Georgia:
- Overall poverty rate: 13.3%
- Child poverty rate: 18.7%
- Minority poverty rate: 17.9%
- Total residents below the poverty level: 1,373,909
- Total children below the poverty level: 461,456
- Total minority residents below the poverty level: 887,991
For reference, here are the statistics for the entire United States:
- Overall poverty rate: 12.3%
- Child poverty rate: 16.8%
- Minority poverty rate: 17.3%
- Total residents below the poverty level: 39,490,096
- Total children below the poverty level: 12,000,470
- Total minority residents below the poverty level: 22,138,000
For more information, a detailed methodology, and complete results, you can find the original report on Self’s website: https://www.self.inc/blog/cities-with-the-highest-poverty-rates
|
|
|
|
|


